Exit Velocity, Launch Angle, Average Distance, Spin Rate, Catch Probability -- these are the cutting edge metrics driving today's modern baseball strategy in major league baseball (MLB).
This isn't just for baseball data geeks. Baseball executives and field managers are now balancing the use of their instincts and past experiences with this cutting edge data by leveraging these statistics to drive decisions about roster make-up, minor league development approach and in-game strategy options -- based on statistical probabilities.
Maybe you're not a baseball fan and you're not really interested in the use of modern baseball statistics. But as a business leader, maybe you should be. This could be a window into your organization's future. Your organization, business unit, function or process should be answering the analogous question, "What is Your Exit Velocity?"
Deconstructing the Process Down to the Core Steps -- To Use Data as a Decision Driver
With the advanced use of radar and cameras (Statcast), MLB teams are deconstructing the swing, the pitch, and the fielding of a batted ball. This has been an explosion of available data that teams can use to gain a strategic advantage through better positioning of fielders, pitching strategy and pitch selection by batters. Check out this video of a runner being thrown out at home plate trying to score.
Teams are using this data to attempt to gain a strategic advantage in all facets of the game -- hitting, pitching and defense. It is also impacting how the game is being played. Defensively, teams are positioning their fielders in non-traditional places. Runs per game are declining. Games are getting longer because of all the available data to use in making in-game decisions. Last year's World Series winner, the Houston Astros, were strongly committed to the use of advanced baseball metrics to gain a strategic advantage. Umpires are also becoming more accurate and consistent because of the use of the simulated strike zones on televised baseball games (and umpires are likely being coached to improve based on this data.)
Check out this link to the article, "The New Science of Hitting" to see how Statcast measures the probability of a positive outcome of a deconstructed step of a batter striking the ball with the bat. The following graphic from the article presents a model for greater success using these measures:
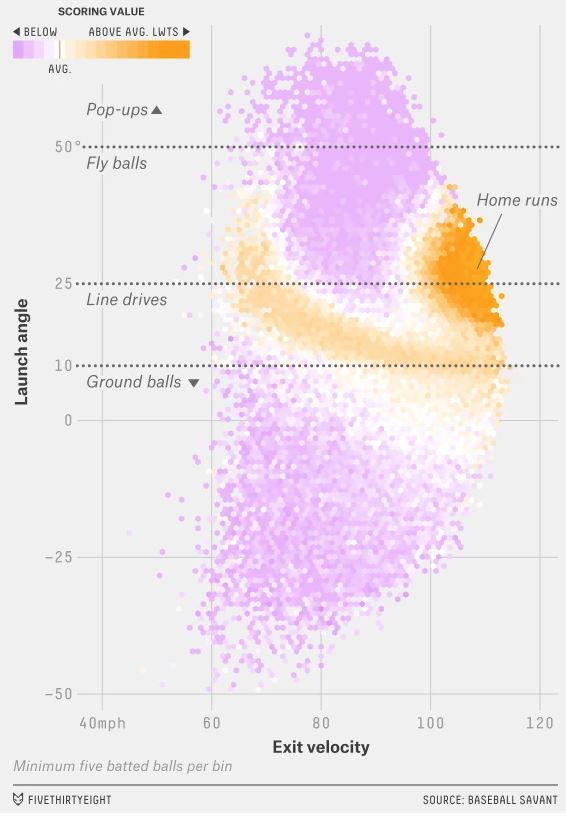
This model shows that the probability of a homerun is the highest when the exit velocity (speed in which the ball leaves the bat) exceeds 100 mph and the launch angle (the vertical angle of the ball when it leaves the bat) is between 22 and 28 degrees.
How can your organization deconstruct critical path process steps and measure them to utilize data to identify success differentiators to gain an advantage? How about the use of geospatial data to track assets, teams, and customers providing services in the field to coach field representatives on route efficiency, turnaround time for service execution, etc.? How about manufacturers integrating sensors in their products to do real-time operating surveillance and trigger preventative maintenance? Some of you may be seeing this at work when your auto service facility contacts you when it is time for your periodic maintenance. I now have a maintenance plan with my HP printer that alerts HP on when my ink is running low so they can automatically send new ink.
Leveraging Multiple Streams of Independent Data
Baseball teams can gain a further advantage by leveraging the use of multiple, independent streams of data. They are now measuring a hitter's effectiveness by analyzing a hitter's batting average with other streams of data like their batting average against their opponent's pitchers, day game vs. night game, game time temperature, the runner scenarios (no runners on base, runner only on first, runners in scoring position, bases loaded, etc.), pitch location, against right handed vs. left handed pitchers, exit velocity, launch angle, etc.
As of the date of this writing, one of the Astros, Yuli Gurriel, has a batting average of .300 (averages 3 hits in every 10 at-bats). He also leads the majors in batting average with runners in scoring position (runners on second and/or third base). MLB uses independent streams of data and calls that "splits." Take a look at data from Yuri Gurriel's highest batting average splits:
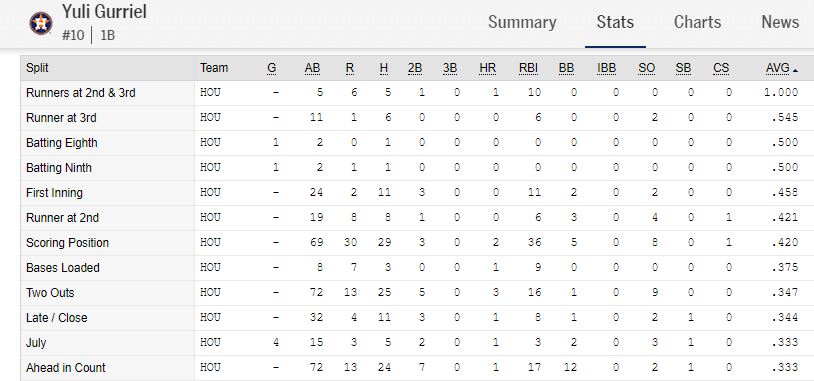
Contrast that with his lowest batting average splits:

You'll notice he is batting .420 with runners in scoring position (runners at 2nd and/or 3rd) which is leading the major leagues. His probability of driving a run in during key situations in the game is higher than other players. You also will notice that his batting average with a runner only at first is .254, much lower than with runners in scoring position.
Maybe, in your sales organization/function, one of your deconstructed core process steps is the verbal presentation of a proposal. Like baseball, you can consider multiple, independent streams of data to cluster and correlate with this deconstructed core process step -- such as:
- base value of the proposal
- value of up-sells in the proposal
- highly competitive bidding situation or sole source proposal
- morning vs. afternoon proposal time
- the number of in-person meetings with prospect prior to the proposal presentation
- proposal presentation is in person, video conference (including Skype, Face Time) or landline/mobile phone only
- one person presenting from your company vs. multiple people presenting
- meeting is with economic buyer -- yes or no
- lead from warm referral, prior customer or cold lead
- turnaround time for proposal meeting
- prior to the meeting intelligence gathering about all attendees and their expectations
- technology for the presentation and discussion - helps the meeting be more effective vs. becoming a barrier to meeting effectiveness
- during or after the presentation, prospect asks for significant modification to the proposal
- prospect returns our calls after the presentation -- yes or no
- successful outcome -- sale of the base value
- successful outcome -- sale of up-sells
You can see that there are multiple streams of data above -- prior to the proposal presentation, during the meeting and follow-up after the meeting. There are different types of data -- dollars, time, people, approach, actions after the meeting, etc.
Data scientists and analysts can statistically correlate and cluster the data gathered to look for patterns and probabilities that can positively impact decision-making in the future.
Tim Phillips, CEO of Revenade, a firm that specializes in helping its clients sell more faster, believes that sales has a lot of analogous opportunities to baseball when it comes to learning from high value metrics, "Salespeople are like hitters. They need to be good at recognizing the pitch coming at them, they need to keep their eye on the ball and they need to be in the zone. In other words, they need to recognize what the opportunity is and who the client is, they need to stay focused on what it takes to be successful and they need to be able to be able to block out distractions so they are as natural as could be in interacting with the prospect."
Recommended Next Steps
Step 1: Deconstruct the Process Down to the Core Steps in the Critical Path to Success
Just as a desconstructed core process step of baseball hitting is when the hitter strikes the ball with the bat, there are core deconstructed process steps in your key business processes. For example, in employee onboarding, a core process step of having a single point of contact for the new hire can be instrumental in creating fit with the organization and help the new hire feel a part of the team. High fit with the organization equals high engagement and increases the likelihood to stay resulting in lower turnover, higher retention and lower recruitment costs. In a supply chain management function, it might be preparation of the RFP (request for proposals) to outline what the requirements of the supplier -- a key driver to improving the quality of what suppliers deliver.
Step 2: Measure the Core Steps in the Critical Path to Success
After defining the deconstructed process step and the success outcome from Step 1 above (e.g. improve quality of what suppliers deliver through a more effective RFP):
- Engage your data scientists and IT function to prepare your data -- data sources, most efficient way to access the data
- Determine statistical analysis techniques to analyze the data for similarities or correlations in the data, etc.
- Develop/test your model for predicting probability of the success outcome/objective.
Step 3: Enhance Your Model by Utilizing Additional Independent Data Streams
For the process being considered in the probability model in Step 2, gather thoughts from experts inside or outside the company for the different factors. Determine which of those factors can be measured and which can add to the model in Step 2 to increase the probability of the success outcome.
In our example above about the sales function/organization, Tim Phillips provided me with some excellent suggestions of data that could be captured and data that would be of high value. Tim is an expert on accelerating sales through action-oriented processes. His firm, Revenade, provides a dynamic, scalable, selling system with focused strategies, step-by-step processes, and knowledge capture capability.
Step 4: Collaborate with Executives and Senior Leaders to Consider Strategic Goals and/or Execution Decisions Based on Utilization of the Model
A.J. Hinch, manager of the 2017 World Series winning Houston Astros, is more of a hybrid when it comes to use of this data. The Astros are very progressive in tracking and analyzing all this data. He has said that it is important to go in with a good plan but also to trust your eyes and and ride a hunch. The analytics would not have suggested that he use starting pitchers Brad Peacock and Charlie Morton to pitch almost 4 innings to close out two World Series games. But A.J. Hinch trusted his eyes.
In your organization, gather all the relevant data you can and develop your leaders to utilize the data to develop a plan but to trust the reality of what they are seeing to make the best decisions to maximize results. The more robust the analytics are, the more effective the hunch or gut feel will be. A leader should not fear going against the analytics. They should only fear not considering the analytics before they trust their gut.
Step 5: Coach Those Executing the Deconstructed Process Steps to Learn and Develop Using the Predictive Analytics Models
No one metric will ever define success. Every team member needs to contribute but the contribution doesn't need to be equal. So these advanced metrics can help measure the different contributions of team members.
Like all metrics, the greatest value is in coaching the employee to utilize the data to improve their skills to perform at a higher level. That means that the leader needs to enhance their coaching skills so they create a learning environment and safe space. Then the data can show that there is an opportunity to learn and perform better. The more metrics are used for learning, the more useful they will be.
Of course, metrics like these are data points that can be used to evaluate individual and team performance. But again, the greatest value of the data is the learning it provides and how it can be utilized to make better strategic and execution decisions.
* *
Using high value metrics is not for every organization. It takes a commitment of time and money. It also helps the organization be more scientific in how it sets its strategy and the decisions needed to execute on the strategy. Utilizing data in a "scientific" manner creates more organizational readiness to get a better return on your investment in disruptive automation and robotics. Instincts, experiences and gut-feel should and will always be part of decision-making. But more objective data makes those less rational approaches so much more effective.
Marya Mannes (1904 - 1990 - American Author and Critic) said it best, "The sign of an intelligent people is their ability to control emotions by the application of reason."
"Data as a Decision Driver" is one of the Goodfriend Competencies for Disruptive Leadership -- because leaders of the future will set expectations for team members to deconstruct processes down to the core steps and measure this data to make more effective strategic decisions.
So "What is Your Exit Velocity?"
Mike Goodfriend is a Teamwork Engineer, Leadership Coach and Facilitator for Strategy Meetings. Mike can be reached at 713-789-6840 or via email at mikeg@goodfriendconsulting.com. Book Mike Goodfriend as a speaker for your executive team, leadership conference or professional association meeting with his presentation (Being a Strategic Influencer in the Age of the Jetsons).
© Goodfriend & Associates, Inc., 2018
Sign Up for new Insights
From Our Readers
“I loved your article about Team Offsites. I have been to many offsite meetings that failed because one or more of the items you mentioned was missing."
“I thought the insights you provided were thought provoking and on target. You have a gift at taking these "common life" situations and drawing strong parallels with the business world. Thank you!”
"Mike, thanks for sharing, some good learnings and enjoyed the correlation. I will have to use this on my British colleagues."
"Awesome news letter! It made me smile and refresh some great memories I had as a kid. Greatest lessons in life I ever learned were on a baseball diamond as a kid. Thanks."
Dr. Jekyll and Mr. Hyde. A clever way to explain and consider the Birkman Method. I appreciate you sending this to me!
"Well done. Your best Goodfriend Insights yet."